Research Highlights – Magnetism I
Home » Faculties of Science » Departments » Physics » Research » Research Highlights »Hysteretic Spin-Density-Wave Ordering in Confined Geometries
Eric E. Fullerton, J.L. Robertson, A.R.E. Prinsloo, H.L. Alberts, S.D. Bader
We have measured the antiferromagnetic spin-density-wave (SDW) order in Cr/Cr97.5Mn2.5(001) superlattices. The Mn doping creates a high Néel temperature layer that confines the incommensurate SDW order within the Cr layers. With temperature cycling we observe a transition from commensurate to incommensurate SDW order and discrete changes in the SDW period. We find that these transitions show significant hysteresis (up to 75 K) when the number of SDW nodes within the Cr layer changes by an odd number, while there is no hysteresis for changes of an even number of nodes. This results from the competition between maintaining the spin structure at the interfaces and introducing a spin slip at the nodes of the Cr SDW.
Physical Review Letters 91, 237201 (2003).
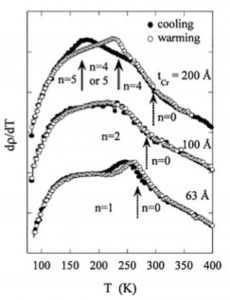
Figure: Derivatives of the measured resistance vs temperature during warming and cooling cycles. The dashed arrows indicate the temperatures where the neutron scattering determined a transition from ISDW to CSDW order. The two solid lined arrows indicated for the 200-Å sample where the neutron scattering determined transitions from n=4 to n=5 nodes in the Cr ISDW. The single lined arrow corresponds to cooling, while the double lined arrow marks the transition during warming.
Influence of V and Mn doping on the electrical transport properties of a Cr + 1.2 at.% Ga alloy
K.T. Roro, A.R.E. Prinsloo, H.L. Alberts
Measurements of the electrical resistivity (ρ) of a Cr + 1.2 at.% Ga alloy doped with V or Mn, are reported in the temperature range 6–900 K. These measurements were complimented with thermal expansion (α) measurements for the undoped Cr + 1.2 at.% Ga alloy in the temperature range 77–450 K. The measurements show interesting behaviour with dopant concentration in that the residual resistivity (ρresidual) does not vary smoothly with dopant concentration as expected. On the contrary, ρresidual shows three peaks as a function of dopant concentration. This behaviour is ascribed to impurity resonant scattering effects which are included in a theoretical model used to explain the observed temperature dependence of the resistivity for these alloys. The resistivity and thermal expansion coefficient of the Cr + 1.2 at.% Ga alloy behaves anomalously close to the ISDW–CSDW phase transition temperature (TIC). The temperature derivative of the resistivity shows a minimum while the α–T curve shows a peak at TIC in contrast to what is expected. The magnetic phase diagram of the (Cr + 1.2 at.% Ga)(V, Mn) alloy system is constructed from the results of the measurements.
Journal of Alloys and Compounds 393, 16-25 (2005).
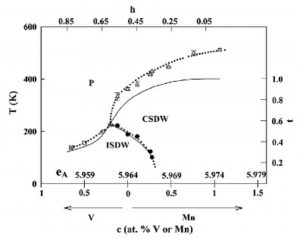
Figure: Concentration–temperature, c–T, magnetic phase diagram for (Cr0.988Ga0.012)1−zVz and (Cr0.988Ga0.012)1−yMny alloy series. The open circles give the ISDW–P phase transition boundary, the open triangle pointing up the CSDW–P phase transition boundary points and the closed circles the ISDW–CSDW phase transition boundary points. The dotted lines represent the phase boundaries calculated from the two-band imperfect nesting model. The electron-to-atom ratio, eA, is also plotted on the abscissa. Also shown are the parameters h and t, being, respectively, the reduced temperature and nesting parameter of the theory.
Antiferromagnetism in a Cr86Ru14 alloy
L. Reddy, H.L. Alberts, A.R.E. Prinsloo, A.M. Venter
The magnetic behaviour of an antiferromagnetic polycrystalline Cr86Ru14 alloy has been investigated experimentally through electrical resistivity (ρ), thermal expansion, elastic constants and neutron diffraction measurements. This Cr–Ru alloy represents an important and interesting position on the magnetic phase diagram, just below the concentration where Ru addition totally suppresses antiferromagnetism in the Cr–Ru system. The neutron diffraction investigation shows the alloy to have commensurate (C) spin-density-wave (SDW) ordering below the Néel temperature TN = 294 K. Magnetic anomalies are observed in the temperature and pressure dependences of ρ, giving dTN/dP = −41 K/GPa, which is more than an order of magnitude smaller in its absolute value than that observed for the CSDW to paramagnetic Néel temperature of very diluted Cr–Ru alloys, such as Cr99.7Ru0.3. The thermal expansion measurements give a magnetovolume of |Δω(77 K)| = 2 × 10⁻⁴ for CSDW Cr86Ru14 at 77 K compared to a much larger value, |Δω(77 K)| = 32 × 10−4, for CSDW diluted Cr99.7Ru0.3. The long-wavelength acoustic-mode Grüneisen parameters for Cr86Ru14 calculated from the temperature and hydrostatic pressure dependences of the elastic constants show that the effects of the CSDW on the vibrational anharmonicity near TN is substantially weaker than that observed in the diluted Cr99.7Ru0.3 alloy. Anomalous elasticity behaviour is observed for Cr86Ru14 in the temperature region of the Néel transition that is ascribed to antiferromagnetic Q-domain effects.
Journal of Alloys and Compounds 426, 83-92 (2006).
Magnetic effects in an itinerant electron antiferromagnetic Cr+1.72 at. % Fe alloy single crystal
A.R.E. Prinsloo, H.A. Derret, H.L. Alberts, A.M. Venter
Measurements of the temperature and pressure dependences of the longitudinal-mode ultrasonic wave velocities (νL) as well as the temperature dependence of the electrical resistivity (ρ) of a Cr1−cFec alloy single crystal with c = 0.0172 are reported. The νL−T curve displays two prominent anomalies of magnetic origin. One is a deep minimum at the Néel temperature (TN = 274 K) and the other a sharp change in slope at a lower temperature Tt = 243 K. The anomaly at Tt is absent on the ρ−T curve, but the Néel transition is accompanied by a very prominent continuous rise in ρ on cooling through TN. The observations at Tt cannot be directly explained in light of the present magnetic phase diagram of the Cr–Fe system. There is a large contribution of about 50% from magnetic effects to the residual resistivity of Cr+1.72 at.% Fe at 0 K. This contribution is ascribed to spin-density-wave and local impurity effects.
Journal of Applied Physics 99, 08F706 (2006).
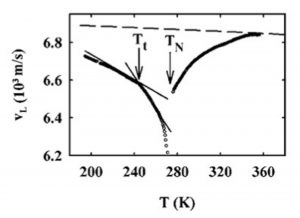
Figure: The temperature dependence on heating of the longitudinal wave velocity, vL, for the Cr+ 1.72 at. % Fe alloy single crystal. The broken curve shows the expected nonmagnetic behavior determined using the results on Cr+5 at. % V. The solid lines indicate the linear behavior in the regions below and above Tt and are guides to the eye added to make the vL anomaly at Tt more visible.
Influence of growth morphology on the Néel temperature of CrRu thin films and heterostructures
A.R.E. Prinsloo, H.A. Derret, O. Hellwig, E.E. Fullerton, H.L. Alberts, N. van den Berg
Dimensionality effects on epitaxial and polycrystalline Cr1−xRux alloy thin films and in Cr/Cr–Ru heterostructures are reported. X-ray analysis on Cr0.9965Ru0.0035 epitaxial films indicates an increase in the coherence length in growth directions (1 0 0) and (1 1 0) with increasing thickness (d), in the range 20≤d≤300 nm. Atomic force microscopy studies on these films shows pronounced vertical growth for d>50 nm, resulting in the formation of columnar structures. The Néel temperatures (TN) of the Cr0.9965Ru0.0035 films show anomalous behaviour as a function of d at thickness d≈50 nm. It is interesting to note that this thickness corresponds to that for which a change in film morphology occurs. Experiments on epitaxial Cr1−xRux thin films, with 0≤x≤0.013 and d=50 nm, give TN–x curves that correspond well with that of bulk Cr1−xRux alloys. Studies on Cr/Cr0.9965Ru0.0035 superlattices prepared on MgO(1 0 0), with the Cr layer thickness varied between 10 and 50 nm, keeping the Cr0.9965Ru0.0035 thickness constant at 10 nm, indicate a sharp decrease in TN as the Cr separation layers reaches a thickness of 30 nm; ascribed to spin density wave pinning in the Cr layers for d<30 nm by the adjacent CrRu layers.
Journal of Magnetism and Magnetic Materials 322, 1126-1129 (2010).
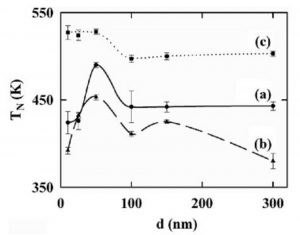
Figure: The Neel temperature (TN) of the Cr0.9965Ru0.0035 thickness series as a function of thickness (d) for samples prepared on (a) MgO(100), (b) a-plane sapphire and (c) polycrystalline quartz. The lines are guides to the eye.