ZORROASTER
Home » Faculties of Science » Departments » Physics »![]()
Z-limited Optical Region Register Of AGN Spectra, Types & Emission Ratios
Download ZORROASTER
A detailed description of the catalogue may be viewed HERE
Originator: Hartmut Winkler, Department of Physics, University of Johannesburg, PO Box 524, 2006 Auckland Park, South Africa, email:
ZORROASTER is an internet-based catalogue of active galactic nuclei (AGN) and atlas of AGN optical spectra. Its second (2013) version contains 3488 catalogues entries and over 1000 spectral images. It has been compiled as four MS-Excel spreadsheets (0h-6h; 6h-12h; 12h-18h and 18h-24h) with diagrams of the spectra (in PNG format) embedded in one of the spreadsheet cells.
This 2013 version has been limited to AGN with the following characteristics:
- a redshift of z ≤ 0.100
- a clearly visible broad emission line component (traditional AGN classification Seyfert 1, 1.2, 1.5, 1.8 or 1.9)
- notwithstanding condition (ii), the catalogue also lists objects that are apparently erroneously described as class Seyfert 1, 1.2, 1.5 or 1.8 (with z ≤ 0.100) in the 13th edition of the Véron-Cetty & Véron
- the process of including objects with Seyfert 2 and LINER spectra is ongoing. Only some of these (the better known ones) appear in the list at present
- This second 2013 version in addition contains a supplement with the entire list of 1515 Markarian galaxies
Instructions on how to use the catalogue and interpred data
ZORROASTER 2013-version structure:
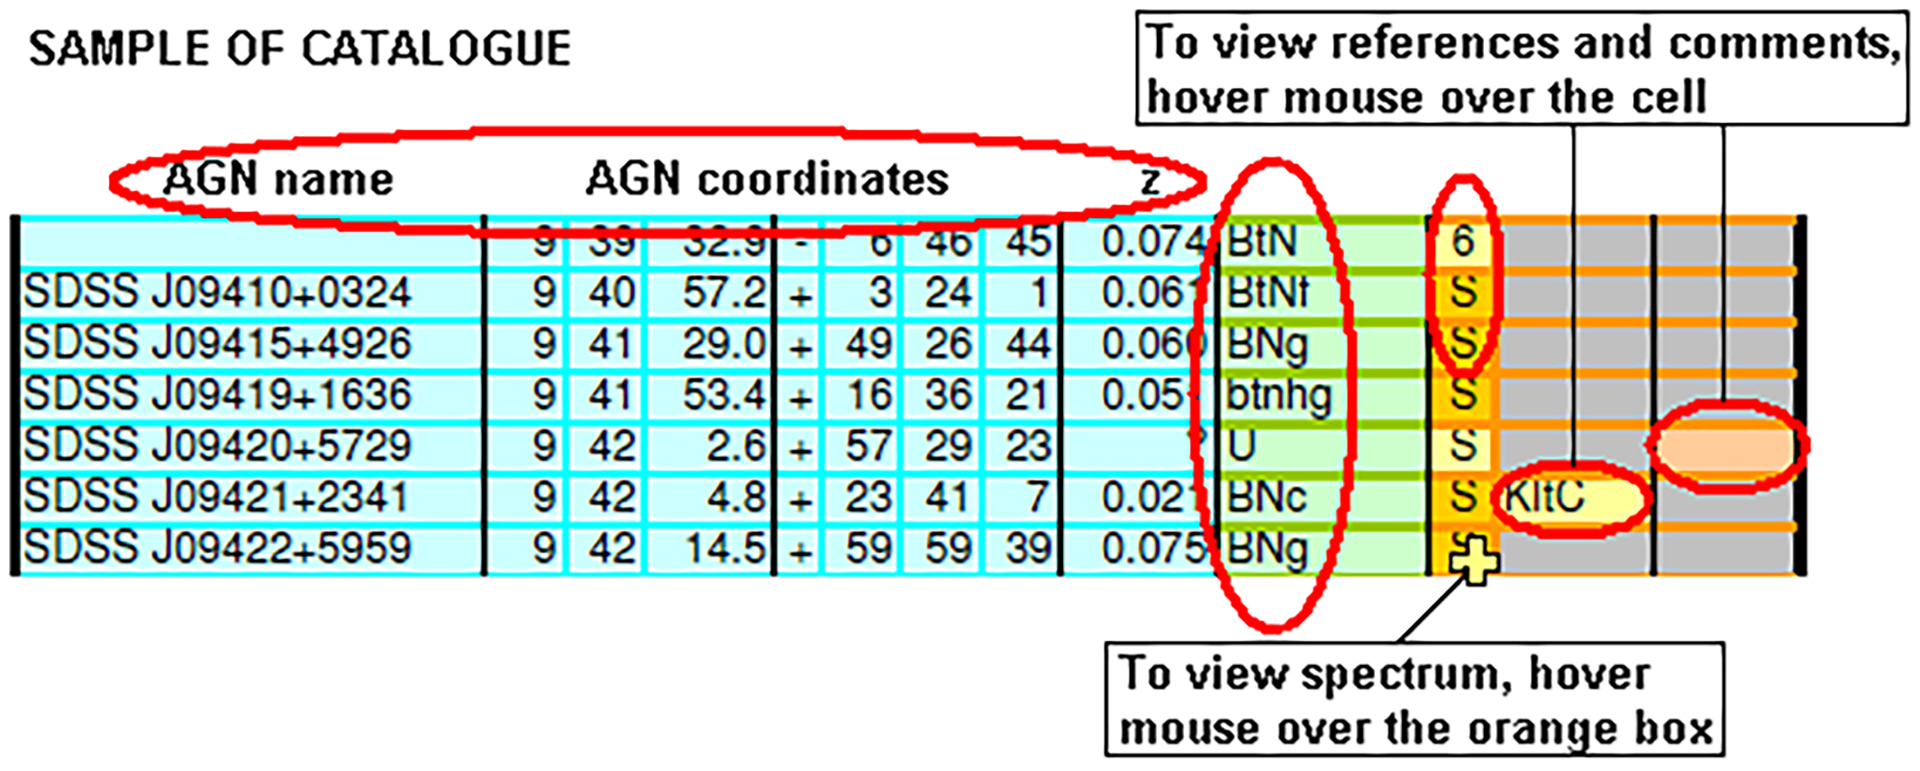
Columns A-I: AGN name, J2000 coordinates and redshift, mainly adopted from the Véron-Cetty & Véron AGN catalogue, 13th edition
Column J: spectral type descriptor. The codes are fully explained in the detailed catalogue description
Column K: code for any available spectral data.
Orange cells have an embedded spectrum that can be viewed by hovering the mouse over the cell
Column L: code for a futher reference to a spectrum (the full reference is embedded in the cell)
Column M: any additional comment (embedded)
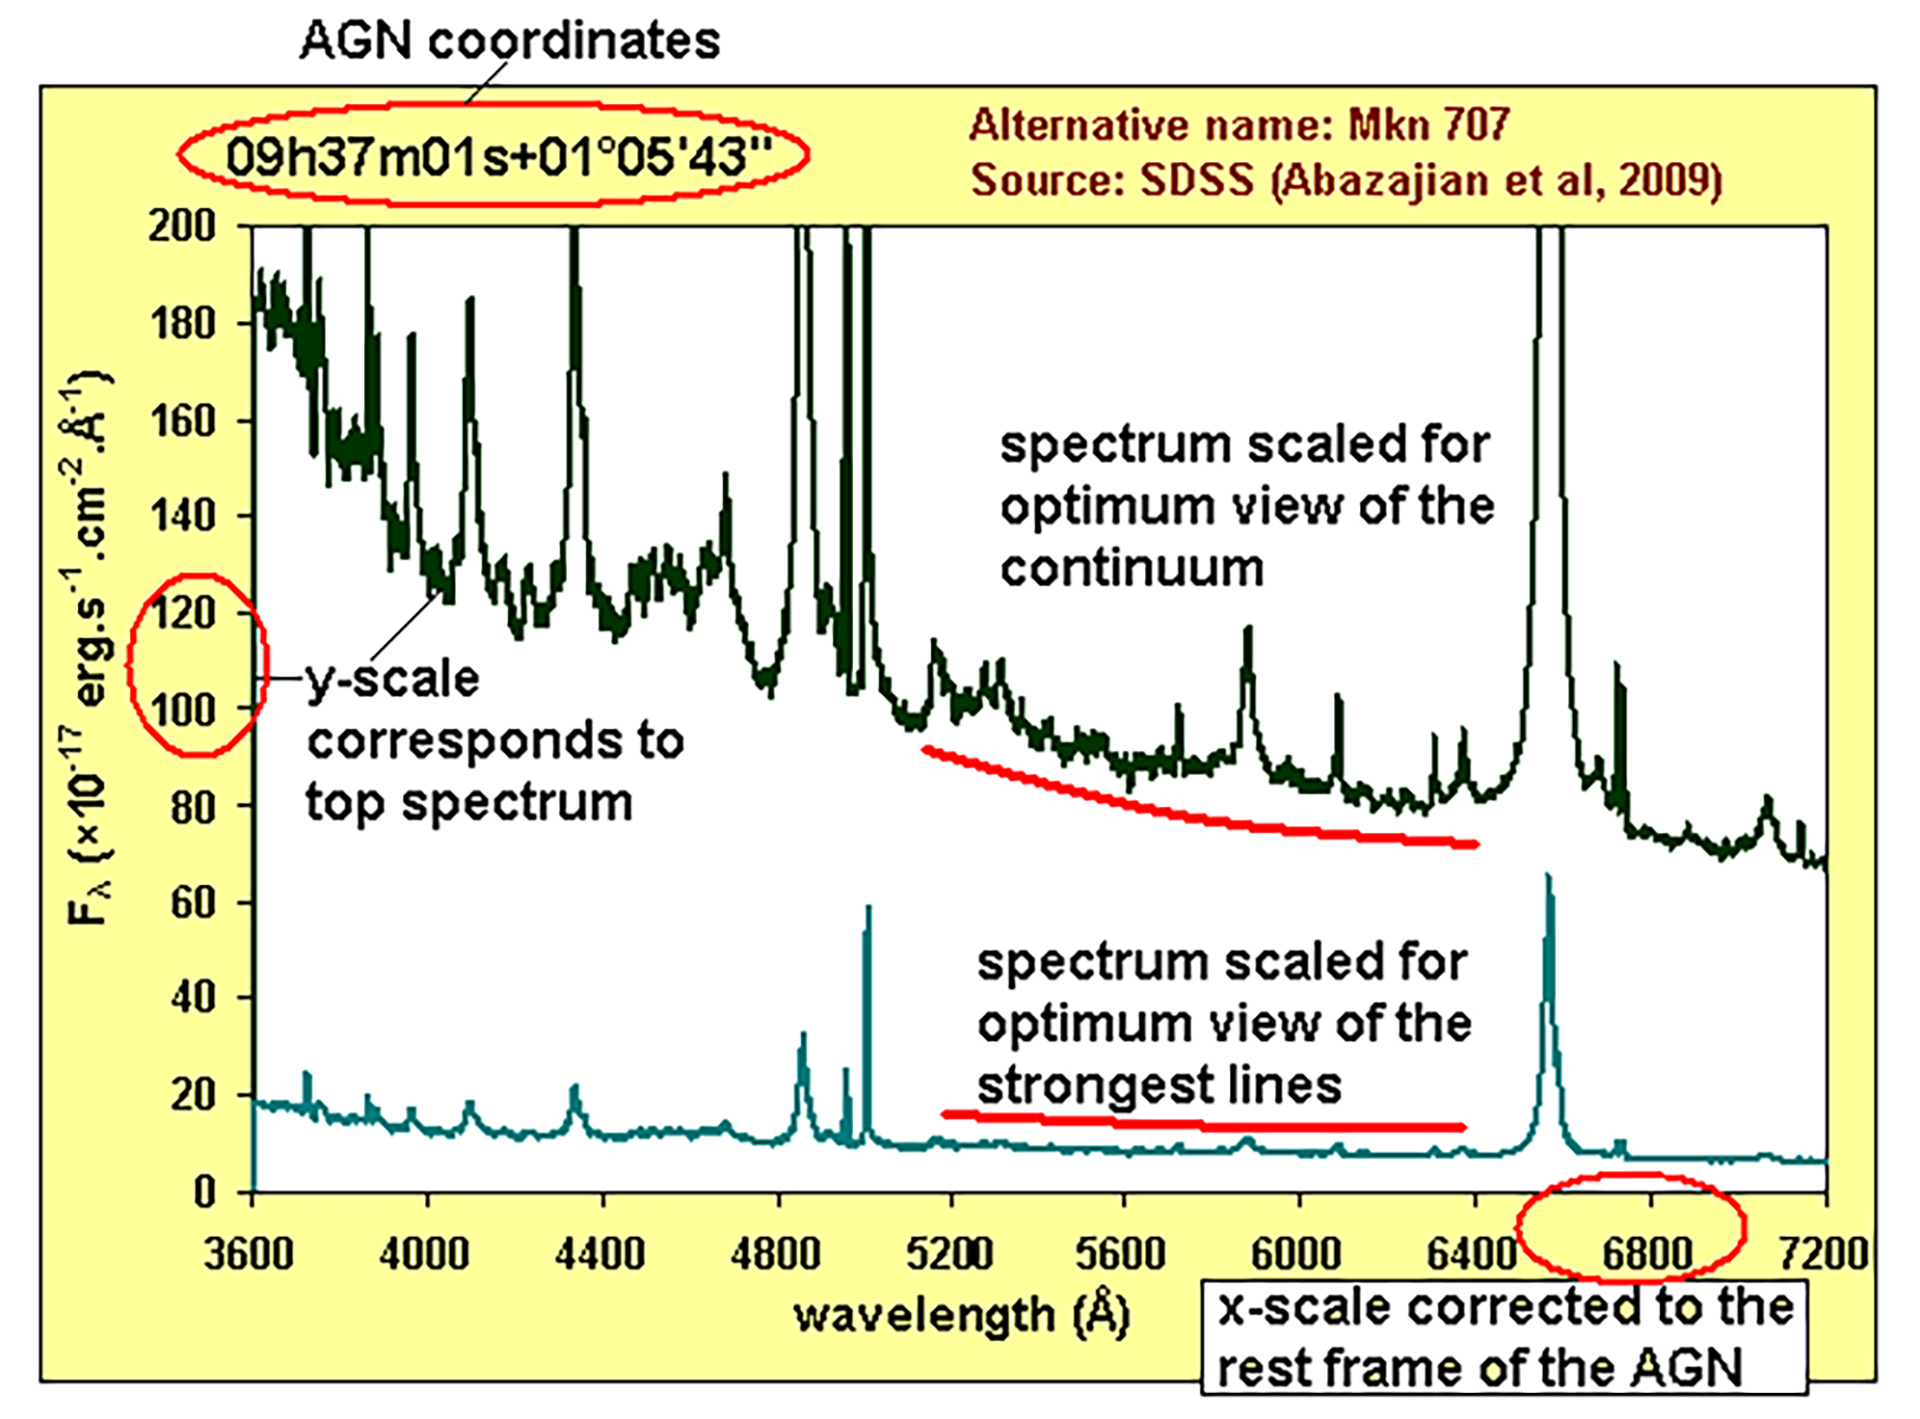
Layout of the spectral image
Each spectral image is labelled by the AGN’s J2000 coordinates, with any alternative name in common usage and the source of the spectrum listed as well.
To enable optimum spectral inter-comparison between various AGN, the spectrum is shown twice: (i) at lower y-magnification to fully display the most prominent spectral lines, and (ii) at greater y-magnification to highlight the weaker features. Furthermore, the horizontal ordinate corresponds to the rest wavelength (i.e. the frame of reference of the AGN’s narrow line region as defined by the [O III] 5007 Å line), and always covers the range 3600-7200 Å.
Markarian galaxy supplement
A special list containing all Markarian objects (irrespective of z) is included as well. Here the first column specifies the Markarian number (meaning that the remaining columns shift by one).